
NOTE: since this article was published, the Firefox remote debugging functionality has changed somewhat. For up-to-date information, you should read Remote Debugging on MDN.
A month ago we introduced the Debugger and other new developer tools introduced in Firefox 15. Our new Debugger lets you connect Firefox Desktop to Firefox on Android so that you can use your nice, roomy desktop monitor to troubleshoot JavaScript that is running on your mobile device. 95% of Android devices are running a Firefox-compatible version of the operating system (Android 2.2 and higher). Firefox won’t run on all of these devices, but there are certainly many millions of devices that you can pick up and begin remote debugging on.
We will now explain how to remote debug Firefox on your Android device. The following screencast also shows you how to setup and run the Remote Debugger:
Set up your desktop
First of all, make sure you’re running Firefox 15 at least. At the time of this article, Firefox 15 is in the beta channel.
Next, type about:config into the Firefox location bar so that you can change a setting in the browser. The browser will display a warning, but don’t worry… we’ll be careful.
In the search box at the top of about:config, type “remote-en“. The only setting that should match is “devtools.debugger.remote-enabled“. Set that to true by double clicking it.
Finally, restart your browser. After you do, you’ll spot “Remote Debugger” in the Web Developer menu (either in the main Firefox menu or in the Tools menu on Macs).
Set up your Firefox for Android
For this to work, you need to use Firefox 15 on your Android device as well, and you can get that by downloading Firefox Beta from the Google Play store.
Now, fire up Firefox Beta on your phone. As on Desktop, you’ll need to go to about:config to change settings. Search for “debugger” and
- toggle devtools.debugger.force-local to false
- toggle devtools.debugger.remote-enabled to true
To get the remote debugging server started, you’ll need to restart Firefox. Tap the home button to exit Firefox.
On a Galaxy Nexus running Jelly Bean you can force Firefox to restart by opening the task switcher and sliding the Firefox Beta task off to the right.
Extra note: if you’re uncomfortable with the idea of having your Firefox listening for connections on the network, you can leave force-local set to true and follow Mark Finkle’s instructions for getting remote debugging running over USB.
Find your IP address
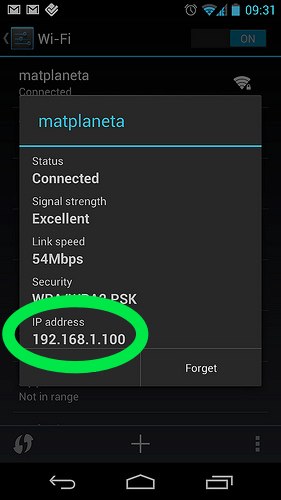
Before we’ll be able to connect to the device, we need to know its IP address. To find the address of your phone:
- open the Settings app
- tap Wifi
- tap the network that you are currently connected to
The display you’re presented with will include your IP address.
Make the connection
You’re now all set for remote debugging!
On your mobile device, browse to a page that you want to debug. Fire up the Remote Debugger on your desktop Firefox. The Remote Debugger appears as a new window and it will prompt you for the address to connect to. Replace “localhost” with the IP address of your phone. By default, the remote debugging server on your mobile device will be running on port 6000, so leave the “:6000” there in the connection address.
You should see a dialog on your phone warning you about a new incoming connection. You should only accept connections that you start as otherwise someone might be trying to hijack your browser. In this case, we’ve started the connection, so go ahead and allow it.
Once you’ve connected successfully, you’ll be able to inspect the scripts loaded in the page, set breakpoints and so forth.
Let us know what you think!
Give it a try and let us know what you think of this feature and what more you’d like to see. You can respond in the comments below or email us on the dev-apps-firefox mailing list.
7 comments